Gene Page: LY75
Summary ?
| GeneID | 4065 |
| Symbol | LY75 |
| Synonyms | CD205|CLEC13B|DEC-205|GP200-MR6|LY-75 |
| Description | lymphocyte antigen 75 |
| Reference | MIM:604524|HGNC:HGNC:6729|Ensembl:ENSG00000054219|Ensembl:ENSG00000248672|HPRD:05161|Vega:OTTHUMG00000132025Vega:OTTHUMG00000161661 |
| Gene type | protein-coding |
| Map location | 2q24 |
| Pascal p-value | 0.003 |
| Fetal beta | -1.36 |
| DMG | 1 (# studies) |
| eGene | Frontal Cortex BA9 Nucleus accumbens basal ganglia Putamen basal ganglia |
Gene in Data Sources
| Gene set name | Method of gene set | Description | Info |
|---|---|---|---|
| CV:PGCnp | Genome-wide Association Study | GWAS | |
| DMG:Wockner_2014 | Genome-wide DNA methylation analysis | This dataset includes 4641 differentially methylated probes corresponding to 2929 unique genes between schizophrenia patients (n=24) and controls (n=24). | 1 |
| GSMA_IIA | Genome scan meta-analysis (All samples) | Psr: 0.02395 |
Section I. Genetics and epigenetics annotation
 Differentially methylated gene
| Probe | Chromosome | Position | Nearest gene | P (dis) | Beta (dis) | FDR (dis) | Study |
|---|---|---|---|---|---|---|---|
| cg10107725 | 2 | 160761556 | LY75 | 1.559E-4 | -0.294 | 0.032 | DMG:Wockner_2014 |
eQTL annotation
| SNP ID | Chromosome | Position | eGene | Gene Entrez ID | pvalue | qvalue | TSS distance | eQTL type |
|---|---|---|---|---|---|---|---|---|
| rs6711770 | 2 | 160692761 | LY75 | ENSG00000054219.9 | 2.221E-6 | 0.01 | 67355 | gtex_brain_putamen_basal |
| rs61010155 | 2 | 160699166 | LY75 | ENSG00000054219.9 | 1.535E-6 | 0.01 | 60950 | gtex_brain_putamen_basal |
| rs2162500 | 2 | 160708645 | LY75 | ENSG00000054219.9 | 3.823E-7 | 0.01 | 51471 | gtex_brain_putamen_basal |
| rs66814375 | 2 | 160716059 | LY75 | ENSG00000054219.9 | 3.789E-7 | 0.01 | 44057 | gtex_brain_putamen_basal |
| rs9636280 | 2 | 160717852 | LY75 | ENSG00000054219.9 | 3.871E-7 | 0.01 | 42264 | gtex_brain_putamen_basal |
| rs7564243 | 2 | 160726868 | LY75 | ENSG00000054219.9 | 3.588E-7 | 0.01 | 33248 | gtex_brain_putamen_basal |
| rs67017730 | 2 | 160732793 | LY75 | ENSG00000054219.9 | 4.645E-7 | 0.01 | 27323 | gtex_brain_putamen_basal |
| rs72957552 | 2 | 160734382 | LY75 | ENSG00000054219.9 | 4.713E-7 | 0.01 | 25734 | gtex_brain_putamen_basal |
| rs66496937 | 2 | 160738509 | LY75 | ENSG00000054219.9 | 4.744E-7 | 0.01 | 21607 | gtex_brain_putamen_basal |
| rs3792198 | 2 | 160760338 | LY75 | ENSG00000054219.9 | 3.63E-6 | 0.01 | -222 | gtex_brain_putamen_basal |
| rs3806603 | 2 | 160761808 | LY75 | ENSG00000054219.9 | 3.598E-6 | 0.01 | -1692 | gtex_brain_putamen_basal |
| rs72957586 | 2 | 160762687 | LY75 | ENSG00000054219.9 | 4.282E-6 | 0.01 | -2571 | gtex_brain_putamen_basal |
| rs57771571 | 2 | 160767804 | LY75 | ENSG00000054219.9 | 3.598E-6 | 0.01 | -7688 | gtex_brain_putamen_basal |
| rs4664304 | 2 | 160794008 | LY75 | ENSG00000054219.9 | 2.063E-6 | 0.01 | -33892 | gtex_brain_putamen_basal |
| rs62175471 | 2 | 160861886 | LY75 | ENSG00000054219.9 | 4.74E-6 | 0.01 | -101770 | gtex_brain_putamen_basal |
| rs3792175 | 2 | 160862804 | LY75 | ENSG00000054219.9 | 3.654E-6 | 0.01 | -102688 | gtex_brain_putamen_basal |
| rs17830558 | 2 | 160878364 | LY75 | ENSG00000054219.9 | 2.257E-6 | 0.01 | -118248 | gtex_brain_putamen_basal |
Section II. Transcriptome annotation
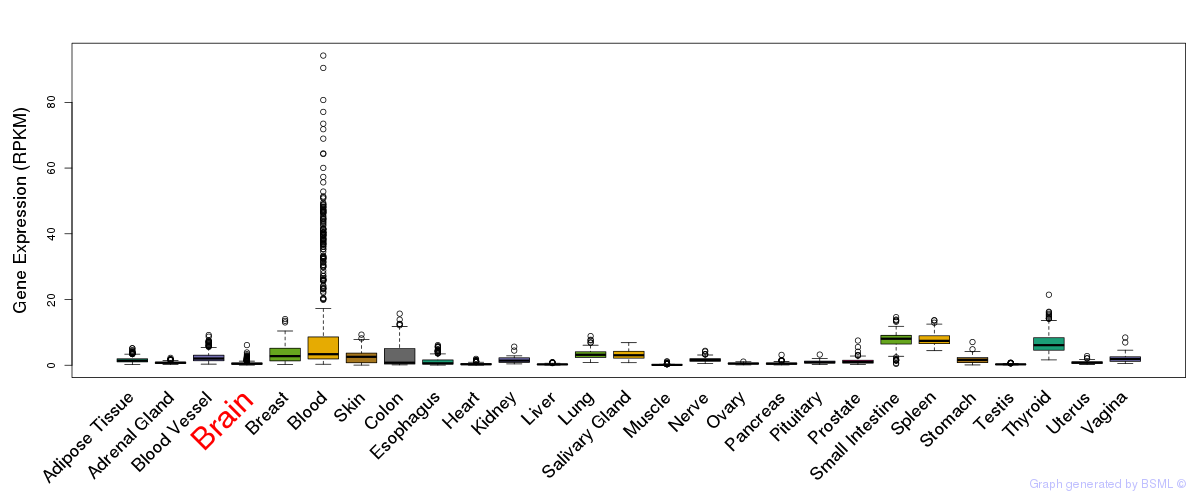
General gene expression (GTEx)
Gene expression during devlopment (BrainCloud)
Footnote:
A total of 269 time points ploted, with n=38 fetal samples (x=1:38). Each triangle represents one time point.
Gene expression of temporal and spatial changes (BrainSpan)
Footnote:
SC: sub-cortical regions; SM: sensory-motor regions; FC: frontal cortex; and TP: temporal-parietal cortex
ST1: fetal (13 - 26 postconception weeks), ST2: early infancy to late childhood (4 months to 11 years), and ST3: adolescence to adulthood (13 - 23 years)
The bar shown representes the lower 25% and upper 25% of the expression distribution.
Top co-expressed genes in brain regions
| Top 10 positively co-expressed genes | ||
| Gene | Pearson's Correlation | Spearman's Correlation |
| TEAD1 | 0.88 | 0.84 |
| PKN2 | 0.85 | 0.85 |
| ARHGAP19 | 0.84 | 0.83 |
| NARG2 | 0.84 | 0.79 |
| NHLRC2 | 0.84 | 0.88 |
| MOBKL1B | 0.83 | 0.78 |
| TMX1 | 0.83 | 0.74 |
| HAUS6 | 0.83 | 0.80 |
| ITGB8 | 0.83 | 0.80 |
| ITGB1 | 0.83 | 0.76 |
| Top 10 negatively co-expressed genes | ||
| Gene | Pearson's Correlation | Spearman's Correlation |
| CXCL14 | -0.46 | -0.58 |
| FXYD1 | -0.46 | -0.56 |
| MT-CO2 | -0.44 | -0.54 |
| AC018755.7 | -0.44 | -0.53 |
| IFI27 | -0.43 | -0.56 |
| MYL3 | -0.43 | -0.52 |
| AF347015.21 | -0.42 | -0.54 |
| AC098691.2 | -0.41 | -0.54 |
| CSAG1 | -0.41 | -0.51 |
| C16orf14 | -0.40 | -0.57 |
Section III. Gene Ontology annotation
| Molecular function | GO term | Evidence | Neuro keywords | PubMed ID |
|---|---|---|---|---|
| GO:0004872 | receptor activity | TAS | 9553150 | |
| GO:0005529 | sugar binding | IEA | - | |
| GO:0005488 | binding | IEA | - | |
| Biological process | GO term | Evidence | Neuro keywords | PubMed ID |
| GO:0006955 | immune response | TAS | 9553150 | |
| GO:0006954 | inflammatory response | TAS | 9553150 | |
| GO:0006897 | endocytosis | IEA | - | |
| Cellular component | GO term | Evidence | Neuro keywords | PubMed ID |
| GO:0016020 | membrane | IEA | - | |
| GO:0009897 | external side of plasma membrane | IEA | - | |
| GO:0005887 | integral to plasma membrane | TAS | 9553150 |
Section V. Pathway annotation
| Pathway name | Pathway size | # SZGR 2.0 genes in pathway | Info |
|---|---|---|---|
| PYEON HPV POSITIVE TUMORS UP | 98 | 47 | All SZGR 2.0 genes in this pathway |
| HOLLMANN APOPTOSIS VIA CD40 DN | 267 | 178 | All SZGR 2.0 genes in this pathway |
| CASORELLI ACUTE PROMYELOCYTIC LEUKEMIA UP | 177 | 110 | All SZGR 2.0 genes in this pathway |
| HORIUCHI WTAP TARGETS UP | 306 | 188 | All SZGR 2.0 genes in this pathway |
| HAHTOLA MYCOSIS FUNGOIDES CD4 DN | 116 | 71 | All SZGR 2.0 genes in this pathway |
| BERENJENO TRANSFORMED BY RHOA REVERSIBLY DN | 29 | 21 | All SZGR 2.0 genes in this pathway |
| GRAESSMANN APOPTOSIS BY SERUM DEPRIVATION UP | 552 | 347 | All SZGR 2.0 genes in this pathway |
| GRAESSMANN RESPONSE TO MC AND SERUM DEPRIVATION UP | 211 | 136 | All SZGR 2.0 genes in this pathway |
| BERENJENO TRANSFORMED BY RHOA UP | 536 | 340 | All SZGR 2.0 genes in this pathway |
| SCHLOSSER SERUM RESPONSE DN | 712 | 443 | All SZGR 2.0 genes in this pathway |
| PUJANA ATM PCC NETWORK | 1442 | 892 | All SZGR 2.0 genes in this pathway |
| SCHAEFFER PROSTATE DEVELOPMENT 48HR UP | 487 | 286 | All SZGR 2.0 genes in this pathway |
| GOTZMANN EPITHELIAL TO MESENCHYMAL TRANSITION UP | 69 | 55 | All SZGR 2.0 genes in this pathway |
| ONDER CDH1 TARGETS 2 DN | 464 | 276 | All SZGR 2.0 genes in this pathway |
| SHEPARD BMYB MORPHOLINO UP | 205 | 126 | All SZGR 2.0 genes in this pathway |
| LU IL4 SIGNALING | 94 | 56 | All SZGR 2.0 genes in this pathway |
| FLECHNER BIOPSY KIDNEY TRANSPLANT OK VS DONOR UP | 555 | 346 | All SZGR 2.0 genes in this pathway |
| SANSOM APC TARGETS DN | 366 | 238 | All SZGR 2.0 genes in this pathway |
| MATSUDA NATURAL KILLER DIFFERENTIATION | 475 | 313 | All SZGR 2.0 genes in this pathway |
| PETROVA ENDOTHELIUM LYMPHATIC VS BLOOD DN | 162 | 102 | All SZGR 2.0 genes in this pathway |
| PETROVA PROX1 TARGETS DN | 64 | 38 | All SZGR 2.0 genes in this pathway |
| RODWELL AGING KIDNEY UP | 487 | 303 | All SZGR 2.0 genes in this pathway |
| CREIGHTON ENDOCRINE THERAPY RESISTANCE 3 | 720 | 440 | All SZGR 2.0 genes in this pathway |
| STEARMAN TUMOR FIELD EFFECT UP | 36 | 22 | All SZGR 2.0 genes in this pathway |
| STEARMAN LUNG CANCER EARLY VS LATE DN | 61 | 39 | All SZGR 2.0 genes in this pathway |
| SMID BREAST CANCER NORMAL LIKE UP | 476 | 285 | All SZGR 2.0 genes in this pathway |
| LABBE WNT3A TARGETS UP | 112 | 71 | All SZGR 2.0 genes in this pathway |
| ICHIBA GRAFT VERSUS HOST DISEASE D7 UP | 107 | 67 | All SZGR 2.0 genes in this pathway |
| LINDSTEDT DENDRITIC CELL MATURATION C | 69 | 49 | All SZGR 2.0 genes in this pathway |
| WUNDER INFLAMMATORY RESPONSE AND CHOLESTEROL UP | 58 | 38 | All SZGR 2.0 genes in this pathway |
| RUTELLA RESPONSE TO CSF2RB AND IL4 UP | 338 | 225 | All SZGR 2.0 genes in this pathway |
| RUTELLA RESPONSE TO HGF UP | 418 | 282 | All SZGR 2.0 genes in this pathway |
| RUTELLA RESPONSE TO HGF VS CSF2RB AND IL4 DN | 245 | 150 | All SZGR 2.0 genes in this pathway |
| SWEET LUNG CANCER KRAS UP | 491 | 316 | All SZGR 2.0 genes in this pathway |
| MEISSNER BRAIN HCP WITH H3K4ME3 AND H3K27ME3 | 1069 | 729 | All SZGR 2.0 genes in this pathway |
| YAGI AML WITH T 8 21 TRANSLOCATION | 368 | 247 | All SZGR 2.0 genes in this pathway |
| MEISSNER NPC HCP WITH H3K4ME2 | 491 | 319 | All SZGR 2.0 genes in this pathway |
| WONG ADULT TISSUE STEM MODULE | 721 | 492 | All SZGR 2.0 genes in this pathway |
| VERHAAK GLIOBLASTOMA MESENCHYMAL | 216 | 130 | All SZGR 2.0 genes in this pathway |
| VANDESLUIS COMMD1 TARGETS GROUP 3 UP | 89 | 50 | All SZGR 2.0 genes in this pathway |
| LEE BMP2 TARGETS DN | 882 | 538 | All SZGR 2.0 genes in this pathway |
| RAO BOUND BY SALL4 ISOFORM A | 182 | 108 | All SZGR 2.0 genes in this pathway |
Section VI. microRNA annotation
| miRNA family | Target position | miRNA ID | miRNA seq | ||
|---|---|---|---|---|---|
| UTR start | UTR end | Match method | |||
| miR-33 | 399 | 405 | 1A | hsa-miR-33 | GUGCAUUGUAGUUGCAUUG |
| hsa-miR-33b | GUGCAUUGCUGUUGCAUUGCA | ||||
- SZ: miRNAs which differentially expressed in brain cortex of schizophrenia patients comparing with control samples using microarray. Click here to see the list of SZ related miRNAs.
- Brain: miRNAs which are expressed in brain based on miRNA microarray expression studies. Click here to see the list of brain related miRNAs.