Gene Page: NMT1
Summary ?
| GeneID | 4836 |
| Symbol | NMT1 |
| Synonyms | NMT |
| Description | N-myristoyltransferase 1 |
| Reference | MIM:160993|HGNC:HGNC:7857|Ensembl:ENSG00000136448|HPRD:01187|Vega:OTTHUMG00000180003 |
| Gene type | protein-coding |
| Map location | 17q21.31 |
| Pascal p-value | 0.01 |
| Sherlock p-value | 0.985 |
| Fetal beta | -1.656 |
| DMG | 1 (# studies) |
| eGene | Putamen basal ganglia |
| Support | Ascano FMRP targets |
Gene in Data Sources
| Gene set name | Method of gene set | Description | Info |
|---|---|---|---|
| CV:PGCnp | Genome-wide Association Study | GWAS | |
| DMG:Wockner_2014 | Genome-wide DNA methylation analysis | This dataset includes 4641 differentially methylated probes corresponding to 2929 unique genes between schizophrenia patients (n=24) and controls (n=24). | 1 |
| PMID:cooccur | High-throughput literature-search | Systematic search in PubMed for genes co-occurring with SCZ keywords. A total of 3027 genes were included. | |
| Literature | High-throughput literature-search | Co-occurance with Schizophrenia keywords: schizophrenia,schizophrenias | Click to show details |
| Network | Shortest path distance of core genes in the Human protein-protein interaction network | Contribution to shortest path in PPI network: 0.0351 |
Section I. Genetics and epigenetics annotation
 Differentially methylated gene
| Probe | Chromosome | Position | Nearest gene | P (dis) | Beta (dis) | FDR (dis) | Study |
|---|---|---|---|---|---|---|---|
| cg16080654 | 17 | 43176852 | NMT1 | 5.725E-4 | 0.403 | 0.049 | DMG:Wockner_2014 |
eQTL annotation
| SNP ID | Chromosome | Position | eGene | Gene Entrez ID | pvalue | qvalue | TSS distance | eQTL type |
|---|---|---|---|---|---|---|---|---|
| rs149804735 | 17 | 43349729 | NMT1 | ENSG00000136448.7 | 3.202E-6 | 0.04 | 211078 | gtex_brain_putamen_basal |
| rs17685379 | 17 | 43352049 | NMT1 | ENSG00000136448.7 | 3.232E-6 | 0.04 | 213398 | gtex_brain_putamen_basal |
| rs3785803 | 17 | 43361213 | NMT1 | ENSG00000136448.7 | 3.472E-6 | 0.04 | 222562 | gtex_brain_putamen_basal |
| rs11079503 | 17 | 43365089 | NMT1 | ENSG00000136448.7 | 3.258E-6 | 0.04 | 226438 | gtex_brain_putamen_basal |
| rs11574815 | 17 | 43365392 | NMT1 | ENSG00000136448.7 | 3.314E-6 | 0.04 | 226741 | gtex_brain_putamen_basal |
| rs35518221 | 17 | 43365441 | NMT1 | ENSG00000136448.7 | 3.317E-6 | 0.04 | 226790 | gtex_brain_putamen_basal |
| rs111882557 | 17 | 43377320 | NMT1 | ENSG00000136448.7 | 3.57E-6 | 0.04 | 238669 | gtex_brain_putamen_basal |
| rs149586082 | 17 | 43377551 | NMT1 | ENSG00000136448.7 | 3.572E-6 | 0.04 | 238900 | gtex_brain_putamen_basal |
| rs112969331 | 17 | 43378398 | NMT1 | ENSG00000136448.7 | 3.58E-6 | 0.04 | 239747 | gtex_brain_putamen_basal |
| rs79442196 | 17 | 43379488 | NMT1 | ENSG00000136448.7 | 3.592E-6 | 0.04 | 240837 | gtex_brain_putamen_basal |
| rs111244088 | 17 | 43379765 | NMT1 | ENSG00000136448.7 | 3.594E-6 | 0.04 | 241114 | gtex_brain_putamen_basal |
| rs75911690 | 17 | 43380115 | NMT1 | ENSG00000136448.7 | 3.599E-6 | 0.04 | 241464 | gtex_brain_putamen_basal |
| rs79789477 | 17 | 43380341 | NMT1 | ENSG00000136448.7 | 3.599E-6 | 0.04 | 241690 | gtex_brain_putamen_basal |
| rs1476533 | 17 | 43383595 | NMT1 | ENSG00000136448.7 | 3.444E-6 | 0.04 | 244944 | gtex_brain_putamen_basal |
| rs75184106 | 17 | 43385263 | NMT1 | ENSG00000136448.7 | 3.371E-6 | 0.04 | 246612 | gtex_brain_putamen_basal |
| rs79039330 | 17 | 43385620 | NMT1 | ENSG00000136448.7 | 3.357E-6 | 0.04 | 246969 | gtex_brain_putamen_basal |
Section II. Transcriptome annotation
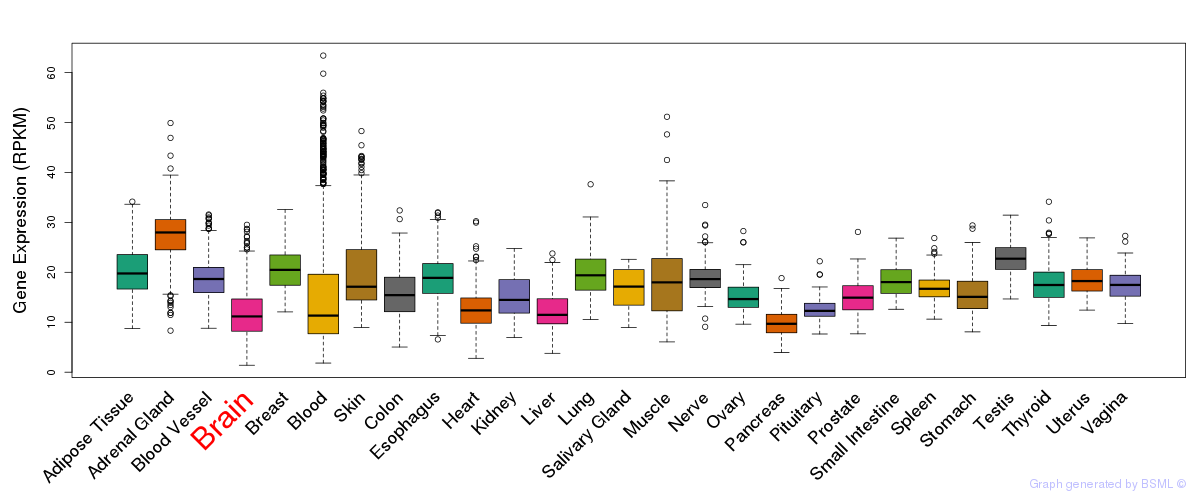
General gene expression (GTEx)
Gene expression during devlopment (BrainCloud)
Footnote:
A total of 269 time points ploted, with n=38 fetal samples (x=1:38). Each triangle represents one time point.
Gene expression of temporal and spatial changes (BrainSpan)
Footnote:
SC: sub-cortical regions; SM: sensory-motor regions; FC: frontal cortex; and TP: temporal-parietal cortex
ST1: fetal (13 - 26 postconception weeks), ST2: early infancy to late childhood (4 months to 11 years), and ST3: adolescence to adulthood (13 - 23 years)
The bar shown representes the lower 25% and upper 25% of the expression distribution.
Top co-expressed genes in brain regions
| Top 10 positively co-expressed genes | ||
| Gene | Pearson's Correlation | Spearman's Correlation |
| TSNAXIP1 | 0.85 | 0.64 |
| WDR66 | 0.85 | 0.69 |
| DLEC1 | 0.83 | 0.56 |
| CCDC39 | 0.83 | 0.64 |
| AC079354.2 | 0.83 | 0.62 |
| C7orf63 | 0.83 | 0.65 |
| DNAH2 | 0.82 | 0.59 |
| LRP2BP | 0.82 | 0.53 |
| RPGR | 0.82 | 0.55 |
| ZBBX | 0.82 | 0.61 |
| Top 10 negatively co-expressed genes | ||
| Gene | Pearson's Correlation | Spearman's Correlation |
| TBR1 | -0.34 | -0.25 |
| SOX5 | -0.33 | -0.16 |
| AFF3 | -0.32 | -0.15 |
| ID2 | -0.32 | -0.29 |
| NEUROD2 | -0.31 | -0.21 |
| PRDM8 | -0.31 | -0.21 |
| BACH2 | -0.31 | -0.12 |
| DAB1 | -0.31 | -0.14 |
| TSHZ3 | -0.31 | -0.17 |
| KCTD12 | -0.31 | -0.19 |
Section III. Gene Ontology annotation
| Molecular function | GO term | Evidence | Neuro keywords | PubMed ID |
|---|---|---|---|---|
| GO:0004379 | glycylpeptide N-tetradecanoyltransferase activity | IEA | - | |
| GO:0016740 | transferase activity | IEA | - | |
| Biological process | GO term | Evidence | Neuro keywords | PubMed ID |
| GO:0001701 | in utero embryonic development | IEA | - | |
| GO:0006499 | N-terminal protein myristoylation | NAS | - | |
| GO:0009249 | protein lipoylation | TAS | 9506952 | |
| Cellular component | GO term | Evidence | Neuro keywords | PubMed ID |
| GO:0005829 | cytosol | EXP | 11099414 | |
| GO:0005575 | cellular_component | ND | - | |
| GO:0005737 | cytoplasm | IEA | - |
Section V. Pathway annotation
| Pathway name | Pathway size | # SZGR 2.0 genes in pathway | Info |
|---|---|---|---|
| REACTOME APOPTOSIS | 148 | 94 | All SZGR 2.0 genes in this pathway |
| REACTOME HIV INFECTION | 207 | 122 | All SZGR 2.0 genes in this pathway |
| REACTOME HIV LIFE CYCLE | 125 | 69 | All SZGR 2.0 genes in this pathway |
| REACTOME LATE PHASE OF HIV LIFE CYCLE | 104 | 61 | All SZGR 2.0 genes in this pathway |
| REACTOME INTRINSIC PATHWAY FOR APOPTOSIS | 30 | 21 | All SZGR 2.0 genes in this pathway |
| DIAZ CHRONIC MEYLOGENOUS LEUKEMIA UP | 1382 | 904 | All SZGR 2.0 genes in this pathway |
| KINSEY TARGETS OF EWSR1 FLII FUSION UP | 1278 | 748 | All SZGR 2.0 genes in this pathway |
| HAHTOLA SEZARY SYNDROM UP | 98 | 58 | All SZGR 2.0 genes in this pathway |
| ENK UV RESPONSE EPIDERMIS UP | 293 | 179 | All SZGR 2.0 genes in this pathway |
| CHIARADONNA NEOPLASTIC TRANSFORMATION KRAS DN | 142 | 95 | All SZGR 2.0 genes in this pathway |
| CHIARADONNA NEOPLASTIC TRANSFORMATION CDC25 DN | 153 | 100 | All SZGR 2.0 genes in this pathway |
| GRAESSMANN APOPTOSIS BY DOXORUBICIN DN | 1781 | 1082 | All SZGR 2.0 genes in this pathway |
| BERENJENO TRANSFORMED BY RHOA UP | 536 | 340 | All SZGR 2.0 genes in this pathway |
| SCHLOSSER SERUM RESPONSE DN | 712 | 443 | All SZGR 2.0 genes in this pathway |
| DAIRKEE TERT TARGETS UP | 380 | 213 | All SZGR 2.0 genes in this pathway |
| GRUETZMANN PANCREATIC CANCER UP | 358 | 245 | All SZGR 2.0 genes in this pathway |
| PUJANA BRCA1 PCC NETWORK | 1652 | 1023 | All SZGR 2.0 genes in this pathway |
| PUJANA CHEK2 PCC NETWORK | 779 | 480 | All SZGR 2.0 genes in this pathway |
| NUYTTEN EZH2 TARGETS UP | 1037 | 673 | All SZGR 2.0 genes in this pathway |
| WEI MYCN TARGETS WITH E BOX | 795 | 478 | All SZGR 2.0 genes in this pathway |
| RICKMAN METASTASIS UP | 344 | 180 | All SZGR 2.0 genes in this pathway |
| BENPORATH NANOG TARGETS | 988 | 594 | All SZGR 2.0 genes in this pathway |
| PENG LEUCINE DEPRIVATION DN | 187 | 122 | All SZGR 2.0 genes in this pathway |
| BECKER TAMOXIFEN RESISTANCE UP | 50 | 36 | All SZGR 2.0 genes in this pathway |
| PENG RAPAMYCIN RESPONSE DN | 245 | 154 | All SZGR 2.0 genes in this pathway |
| PENG GLUTAMINE DEPRIVATION DN | 337 | 230 | All SZGR 2.0 genes in this pathway |
| MOREAUX B LYMPHOCYTE MATURATION BY TACI DN | 73 | 45 | All SZGR 2.0 genes in this pathway |
| MOREAUX MULTIPLE MYELOMA BY TACI DN | 172 | 107 | All SZGR 2.0 genes in this pathway |
| IVANOVA HEMATOPOIESIS STEM CELL LONG TERM | 302 | 191 | All SZGR 2.0 genes in this pathway |
| SESTO RESPONSE TO UV C4 | 20 | 14 | All SZGR 2.0 genes in this pathway |
| WANG CISPLATIN RESPONSE AND XPC DN | 228 | 146 | All SZGR 2.0 genes in this pathway |
| JIANG HYPOXIA NORMAL | 311 | 205 | All SZGR 2.0 genes in this pathway |
| TSENG IRS1 TARGETS UP | 113 | 71 | All SZGR 2.0 genes in this pathway |
| KRASNOSELSKAYA ILF3 TARGETS DN | 46 | 38 | All SZGR 2.0 genes in this pathway |
| WELCSH BRCA1 TARGETS DN | 141 | 92 | All SZGR 2.0 genes in this pathway |
| KYNG DNA DAMAGE BY 4NQO OR UV | 63 | 44 | All SZGR 2.0 genes in this pathway |
| KYNG DNA DAMAGE DN | 195 | 135 | All SZGR 2.0 genes in this pathway |
| ACEVEDO NORMAL TISSUE ADJACENT TO LIVER TUMOR DN | 354 | 216 | All SZGR 2.0 genes in this pathway |
| ACEVEDO LIVER CANCER DN | 540 | 340 | All SZGR 2.0 genes in this pathway |
| YOSHIMURA MAPK8 TARGETS DN | 366 | 257 | All SZGR 2.0 genes in this pathway |
| AGUIRRE PANCREATIC CANCER COPY NUMBER UP | 298 | 174 | All SZGR 2.0 genes in this pathway |
| SWEET LUNG CANCER KRAS UP | 491 | 316 | All SZGR 2.0 genes in this pathway |
| SWEET KRAS ONCOGENIC SIGNATURE | 89 | 56 | All SZGR 2.0 genes in this pathway |
| KUROKAWA LIVER CANCER EARLY RECURRENCE UP | 12 | 9 | All SZGR 2.0 genes in this pathway |
| DANG REGULATED BY MYC DN | 253 | 192 | All SZGR 2.0 genes in this pathway |
| YAO TEMPORAL RESPONSE TO PROGESTERONE CLUSTER 13 | 172 | 107 | All SZGR 2.0 genes in this pathway |
| BRUINS UVC RESPONSE LATE | 1137 | 655 | All SZGR 2.0 genes in this pathway |
| WAKABAYASHI ADIPOGENESIS PPARG RXRA BOUND 8D | 882 | 506 | All SZGR 2.0 genes in this pathway |
| WAKABAYASHI ADIPOGENESIS PPARG RXRA BOUND WITH H4K20ME1 MARK | 145 | 82 | All SZGR 2.0 genes in this pathway |
Section VI. microRNA annotation
| miRNA family | Target position | miRNA ID | miRNA seq | ||
|---|---|---|---|---|---|
| UTR start | UTR end | Match method | |||
| miR-124/506 | 1060 | 1066 | m8 | hsa-miR-506 | UAAGGCACCCUUCUGAGUAGA |
| hsa-miR-124brain | UAAGGCACGCGGUGAAUGCC | ||||
| miR-138 | 2898 | 2904 | 1A | hsa-miR-138brain | AGCUGGUGUUGUGAAUC |
| miR-143 | 3338 | 3344 | 1A | hsa-miR-143brain | UGAGAUGAAGCACUGUAGCUCA |
| miR-204/211 | 251 | 257 | 1A | hsa-miR-204brain | UUCCCUUUGUCAUCCUAUGCCU |
| hsa-miR-211 | UUCCCUUUGUCAUCCUUCGCCU | ||||
| miR-214 | 263 | 269 | 1A | hsa-miR-214brain | ACAGCAGGCACAGACAGGCAG |
| miR-330 | 570 | 576 | 1A | hsa-miR-330brain | GCAAAGCACACGGCCUGCAGAGA |
| miR-362 | 379 | 385 | m8 | hsa-miR-362 | AAUCCUUGGAACCUAGGUGUGAGU |
| miR-369-3p | 331 | 337 | 1A | hsa-miR-369-3p | AAUAAUACAUGGUUGAUCUUU |
| miR-374 | 331 | 337 | m8 | hsa-miR-374 | UUAUAAUACAACCUGAUAAGUG |
| miR-410 | 333 | 339 | 1A | hsa-miR-410 | AAUAUAACACAGAUGGCCUGU |
| miR-493-5p | 374 | 381 | 1A,m8 | hsa-miR-493-5p | UUGUACAUGGUAGGCUUUCAUU |
| miR-7 | 742 | 748 | 1A | hsa-miR-7SZ | UGGAAGACUAGUGAUUUUGUUG |
| miR-9 | 1821 | 1828 | 1A,m8 | hsa-miR-9SZ | UCUUUGGUUAUCUAGCUGUAUGA |
- SZ: miRNAs which differentially expressed in brain cortex of schizophrenia patients comparing with control samples using microarray. Click here to see the list of SZ related miRNAs.
- Brain: miRNAs which are expressed in brain based on miRNA microarray expression studies. Click here to see the list of brain related miRNAs.