Gene Page: BATF3
Summary ?
| GeneID | 55509 |
| Symbol | BATF3 |
| Synonyms | JDP1|JUNDM1|SNFT |
| Description | basic leucine zipper ATF-like transcription factor 3 |
| Reference | MIM:612470|HGNC:HGNC:28915|Ensembl:ENSG00000123685|HPRD:18081|Vega:OTTHUMG00000036807 |
| Gene type | protein-coding |
| Map location | 1q32.3 |
| Sherlock p-value | 0.097 |
| Fetal beta | -1.601 |
| DMG | 1 (# studies) |
| eGene | Cortex Frontal Cortex BA9 Nucleus accumbens basal ganglia Myers' cis & trans Meta |
Gene in Data Sources
| Gene set name | Method of gene set | Description | Info |
|---|---|---|---|
| CV:PGCnp | Genome-wide Association Study | GWAS | |
| DMG:Jaffe_2016 | Genome-wide DNA methylation analysis | This dataset includes 2,104 probes/CpGs associated with SZ patients (n=108) compared to 136 controls at Bonferroni-adjusted P < 0.05. | 1 |
Section I. Genetics and epigenetics annotation
 Differentially methylated gene
| Probe | Chromosome | Position | Nearest gene | P (dis) | Beta (dis) | FDR (dis) | Study |
|---|---|---|---|---|---|---|---|
| cg06150468 | 1 | 212874085 | BATF3 | 5.35E-9 | -0.018 | 2.97E-6 | DMG:Jaffe_2016 |
eQTL annotation
| SNP ID | Chromosome | Position | eGene | Gene Entrez ID | pvalue | qvalue | TSS distance | eQTL type |
|---|---|---|---|---|---|---|---|---|
| rs12128789 | chr1 | 212852831 | BATF3 | 55509 | 0.01 | cis | ||
| rs7655225 | chr4 | 170265627 | BATF3 | 55509 | 0.11 | trans | ||
| snp_a-2211190 | 0 | BATF3 | 55509 | 0.16 | trans | |||
| rs1829763 | chr11 | 80749449 | BATF3 | 55509 | 0.19 | trans |
Section II. Transcriptome annotation
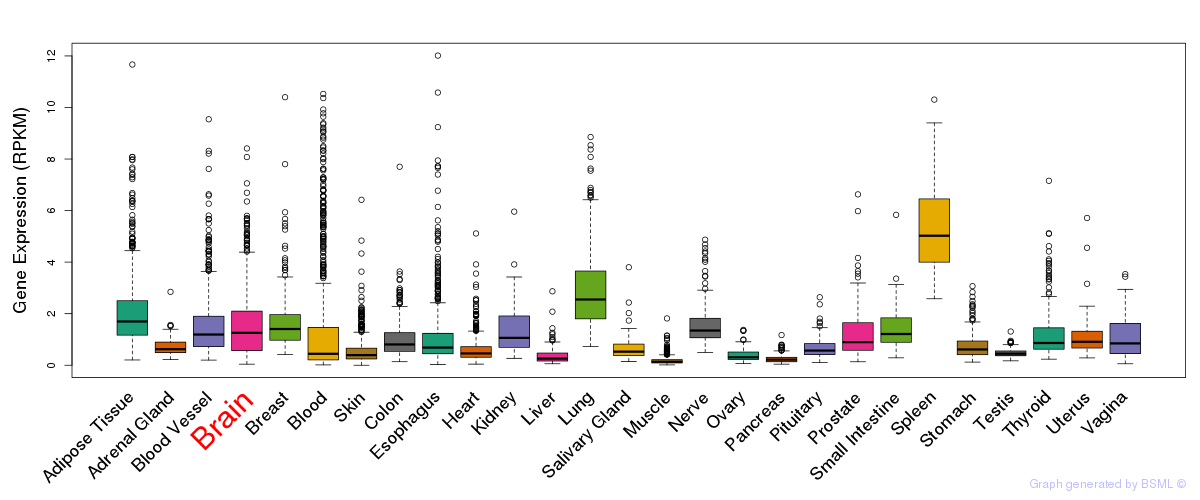
General gene expression (GTEx)
Gene expression during devlopment (BrainCloud)
Footnote:
A total of 269 time points ploted, with n=38 fetal samples (x=1:38). Each triangle represents one time point.
Gene expression of temporal and spatial changes (BrainSpan)
Footnote:
SC: sub-cortical regions; SM: sensory-motor regions; FC: frontal cortex; and TP: temporal-parietal cortex
ST1: fetal (13 - 26 postconception weeks), ST2: early infancy to late childhood (4 months to 11 years), and ST3: adolescence to adulthood (13 - 23 years)
The bar shown representes the lower 25% and upper 25% of the expression distribution.
Top co-expressed genes in brain regions
| Top 10 positively co-expressed genes | ||
| Gene | Pearson's Correlation | Spearman's Correlation |
| PDAP1 | 0.87 | 0.88 |
| ACIN1 | 0.87 | 0.85 |
| LUC7L | 0.86 | 0.88 |
| SNRPD3 | 0.86 | 0.87 |
| DNAJC17 | 0.86 | 0.87 |
| C18orf22 | 0.85 | 0.88 |
| C1orf35 | 0.84 | 0.79 |
| GRK4 | 0.84 | 0.86 |
| NAGK | 0.84 | 0.86 |
| ODF2 | 0.84 | 0.86 |
| Top 10 negatively co-expressed genes | ||
| Gene | Pearson's Correlation | Spearman's Correlation |
| AF347015.27 | -0.70 | -0.78 |
| AF347015.31 | -0.70 | -0.78 |
| MT-CO2 | -0.68 | -0.75 |
| MT-CYB | -0.67 | -0.76 |
| AF347015.33 | -0.67 | -0.75 |
| AF347015.8 | -0.65 | -0.75 |
| AF347015.15 | -0.64 | -0.75 |
| AF347015.2 | -0.64 | -0.77 |
| HLA-F | -0.62 | -0.65 |
| AF347015.9 | -0.62 | -0.74 |
Section V. Pathway annotation
| Pathway name | Pathway size | # SZGR 2.0 genes in pathway | Info |
|---|---|---|---|
| PID NFAT TFPATHWAY | 47 | 39 | All SZGR 2.0 genes in this pathway |
| PID TCR CALCIUM PATHWAY | 29 | 23 | All SZGR 2.0 genes in this pathway |
| FULCHER INFLAMMATORY RESPONSE LECTIN VS LPS UP | 579 | 346 | All SZGR 2.0 genes in this pathway |
| TAKEDA TARGETS OF NUP98 HOXA9 FUSION 10D UP | 194 | 122 | All SZGR 2.0 genes in this pathway |
| HAMAI APOPTOSIS VIA TRAIL DN | 186 | 107 | All SZGR 2.0 genes in this pathway |
| DARWICHE SKIN TUMOR PROMOTER UP | 142 | 96 | All SZGR 2.0 genes in this pathway |
| DARWICHE PAPILLOMA RISK LOW DN | 165 | 107 | All SZGR 2.0 genes in this pathway |
| DARWICHE PAPILLOMA RISK HIGH UP | 147 | 101 | All SZGR 2.0 genes in this pathway |
| DARWICHE SQUAMOUS CELL CARCINOMA DN | 181 | 107 | All SZGR 2.0 genes in this pathway |
| SCHAEFFER PROSTATE DEVELOPMENT 48HR UP | 487 | 286 | All SZGR 2.0 genes in this pathway |
| BENPORATH SUZ12 TARGETS | 1038 | 678 | All SZGR 2.0 genes in this pathway |
| BENPORATH EED TARGETS | 1062 | 725 | All SZGR 2.0 genes in this pathway |
| BENPORATH ES WITH H3K27ME3 | 1118 | 744 | All SZGR 2.0 genes in this pathway |
| BENPORATH PRC2 TARGETS | 652 | 441 | All SZGR 2.0 genes in this pathway |
| ZHAN MULTIPLE MYELOMA CD1 UP | 45 | 29 | All SZGR 2.0 genes in this pathway |
| HU GENOTOXIC DAMAGE 24HR | 35 | 22 | All SZGR 2.0 genes in this pathway |
| KRIGE RESPONSE TO TOSEDOSTAT 6HR UP | 953 | 554 | All SZGR 2.0 genes in this pathway |
| KRIGE RESPONSE TO TOSEDOSTAT 24HR UP | 783 | 442 | All SZGR 2.0 genes in this pathway |
| WINTER HYPOXIA METAGENE | 242 | 168 | All SZGR 2.0 genes in this pathway |
| GOLDRATH ANTIGEN RESPONSE | 346 | 192 | All SZGR 2.0 genes in this pathway |
| YOSHIMURA MAPK8 TARGETS UP | 1305 | 895 | All SZGR 2.0 genes in this pathway |
| RUTELLA RESPONSE TO CSF2RB AND IL4 UP | 338 | 225 | All SZGR 2.0 genes in this pathway |
| RUTELLA RESPONSE TO HGF DN | 235 | 144 | All SZGR 2.0 genes in this pathway |
| RUTELLA RESPONSE TO HGF VS CSF2RB AND IL4 DN | 245 | 150 | All SZGR 2.0 genes in this pathway |
| CHEN METABOLIC SYNDROM NETWORK | 1210 | 725 | All SZGR 2.0 genes in this pathway |
| MEISSNER BRAIN HCP WITH H3K4ME3 AND H3K27ME3 | 1069 | 729 | All SZGR 2.0 genes in this pathway |
| MEISSNER NPC HCP WITH H3K4ME2 | 491 | 319 | All SZGR 2.0 genes in this pathway |
| MIKKELSEN MCV6 HCP WITH H3K27ME3 | 435 | 318 | All SZGR 2.0 genes in this pathway |
| LI INDUCED T TO NATURAL KILLER UP | 307 | 182 | All SZGR 2.0 genes in this pathway |
| WIERENGA STAT5A TARGETS UP | 217 | 131 | All SZGR 2.0 genes in this pathway |
| WIERENGA STAT5A TARGETS GROUP1 | 136 | 76 | All SZGR 2.0 genes in this pathway |
| GOBERT OLIGODENDROCYTE DIFFERENTIATION UP | 570 | 339 | All SZGR 2.0 genes in this pathway |